The empirical function  graphed below represents the population P of a city (in thousands of people) at time t. The _____ of the function is from 1900 to 1980, and the _____ of the function is from approximately 35,000 to 70,000 people.
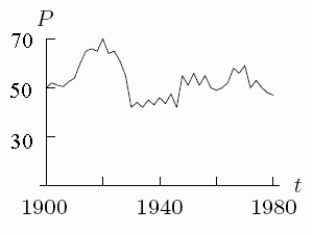
Correct Answer:
Verified
Q1: A. Which two lines in the following
Q2: The equation of the line through the
Q3: The population of Los Angeles, California was
Q4: The bill for electricity is $200 when
Q6: The height (in inches) and weight (in
Q7: Find the value for b in the
Q8: Find a formula for the linear function
Unlock this Answer For Free Now!
View this answer and more for free by performing one of the following actions

Scan the QR code to install the App and get 2 free unlocks

Unlock quizzes for free by uploading documents