Multiple Choice
The graph below shows a marginal cost function,  $ per item. If the fixed cost is $900, estimate the total cost of producing 250 items.
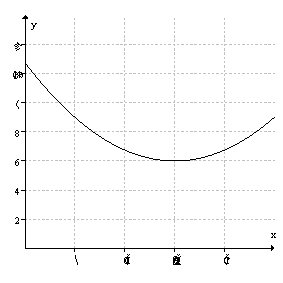
A) $ 2850
B) $ 1950
C) $1530
D) $2950
Correct Answer:
Verified
Related Questions
Q63: The following table gives the rate
Q64: Use the following figure to find the
Q65: If Q66: The graph of f is shown in Q67: Suppose Q69: If a function is concave up, then Q70: The graph of Q71: The graph of Q72: A local business produces souvenirs for the Q73: If Unlock this Answer For Free Now! View this answer and more for free by performing one of the following actions Scan the QR code to install the App and get 2 free unlocks Unlock quizzes for free by uploading documents![]()
![]()
![]()
![]()
![]()

