Multiple Choice
The following figure is a graph of  . On which of the following intervals is f decreasing?
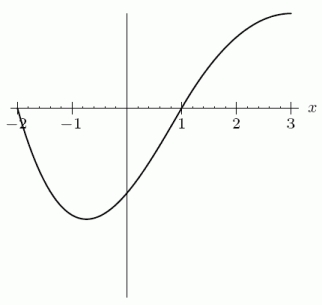
A) 
B) 
C) 
D) 
Correct Answer:
Verified
Related Questions
Q99: A young couple wants to start a
Q100: Your company is downsizing and offers you
Q101: Use integration by parts to find
Q102: 
Q103: Given the following graph of
Unlock this Answer For Free Now!
View this answer and more for free by performing one of the following actions

Scan the QR code to install the App and get 2 free unlocks

Unlock quizzes for free by uploading documents