Multiple Choice
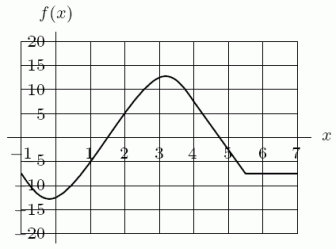
The graph of  is shown in the following figure. Give an estimate for
A) -10
B) 10
C) -20
D) 20
Correct Answer:
Verified
Related Questions
Q54: The noise level, N, in decibels, of
Q55: The graph of Q56: The noise level, N, in decibels, of Unlock this Answer For Free Now! View this answer and more for free by performing one of the following actions Scan the QR code to install the App and get 2 free unlocks Unlock quizzes for free by uploading documents![]()

