Short Answer
The following table shows the number of oranges sold in one month,  , against the price per bag, p (in cents). Find an approximation for
  . Use the nearest right-hand value to make your estimate.
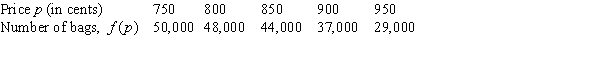
Correct Answer:
Verified
Related Questions
Q48: Let Q49: To study traffic flow along a major Q50: Every day the Undergraduate Office of Admissions Q51: Let Q52: The population of a certain town is Q54: The noise level, N, in decibels, of Q55: The graph of Q56: The noise level, N, in decibels, of Unlock this Answer For Free Now! View this answer and more for free by performing one of the following actions Scan the QR code to install the App and get 2 free unlocks Unlock quizzes for free by uploading documents![]()
![]()
![]()

