The graph of  in the figure gives the position of a particle at time t. Arrange the following values in order from smallest to largest by placing a "1" by the smallest, a "2" by the next smallest, and so forth.
A. average velocity on  .
.
B. average velocity on  .
.
C. instantaneous velocity at t=1.
D. instantaneous velocity at t=3.
E. instantaneous velocity at t=10. 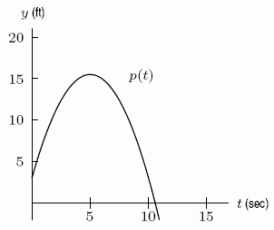
Correct Answer:
Verified
B. 2
...
View Answer
Unlock this answer now
Get Access to more Verified Answers free of charge
Q15: Using a difference quotient, compute 
Q16: Recently Esther swam a lap in an
Q17: A certain function f is decreasing and
Q18: Given the graph below of
Q19: An amount of $500 was invested in
Q21: Using the graph of Q22: Suppose Q23: A certain bacterial colony was observed for Q24: Consider the two functions shown below. A. Q25: Estimate the value of Unlock this Answer For Free Now! View this answer and more for free by performing one of the following actions Scan the QR code to install the App and get 2 free unlocks Unlock quizzes for free by uploading documents![]()
![]()
![]()

