Multiple Choice
The total revenue and cost curves for a product are shown in the following figure. Estimate the production level P that maximizes profit. 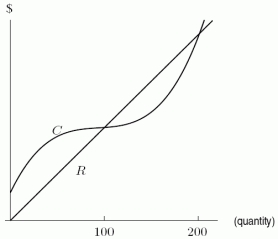
A) 50
B) 100
C) 150
D) 200
Correct Answer:
Verified
Related Questions
Q82: Rank the following products from 1 to
Q83: Given Q84: The concentration of alcohol in the blood Q85: The average cost per item to produce Q86: A water park finds that at an Q88: The average cost per item to produce Unlock this Answer For Free Now! View this answer and more for free by performing one of the following actions Scan the QR code to install the App and get 2 free unlocks Unlock quizzes for free by uploading documents![]()

