The dose response curve in the following figure is given by  , where R is percent of maximum response and x is the dose of the drug in mg. The inflection point is at (10,50) and
  . Would
  be greater or less than 7 for values of x less than 10?
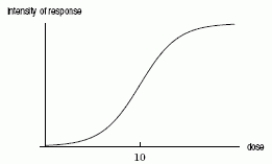
Correct Answer:
Verified
Q69: The following table gives the concentration C,
Q70: If time, t, is in hours and
Q71: The demand curve for a product is
Q72: Raising the average price of an entree
Q73: In Wilson corners, population 2000, a rumor
Q75: A biologist found that the number of
Q76: The rabbit population, P, in a wilderness
Q77: A flu epidemic spreads amongst a group
Q78: A disease is released into a town.
Q79: The peak concentration of 9 ng/ml for
Unlock this Answer For Free Now!
View this answer and more for free by performing one of the following actions

Scan the QR code to install the App and get 2 free unlocks

Unlock quizzes for free by uploading documents