Short Answer
The graph of a cost function is given in the following figure. Estimate the value of q at which average cost is minimized. 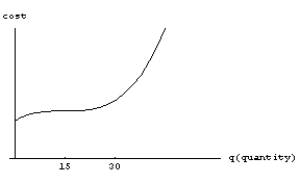
Correct Answer:
Verified
Related Questions
Q41: The cost function, in dollars, is
Q42: The elasticity for a good is E=1.3.
Q43: The average cost per item to produce
Q44: You sell hot dogs at a baseball
Q45: There is only one barber in a
Q47: The demand curve for a product is
Q48: The cost of producing q items is
Q49: A factory produces a product that sells
Q50: The demand equation for a product is
Q51: The Revenue is given by 
Unlock this Answer For Free Now!
View this answer and more for free by performing one of the following actions

Scan the QR code to install the App and get 2 free unlocks

Unlock quizzes for free by uploading documents