Multiple Choice
Which of the following distributions best describe the density function for annual popcorn sales by a Cub Scout pack if the sales are approximately normally distributed and they almost always make between $300 and $500?
A) 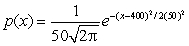
B) 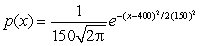
C) 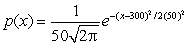
D) 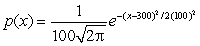
Correct Answer:
Verified
Related Questions
Q56: Using the following figure, calculate the value
Q57: The probability of a plant surviving t
Q58: The density function for the time to
Q59: A professor far away from here gives
Q60: Suppose that the distribution of people's ages
Unlock this Answer For Free Now!
View this answer and more for free by performing one of the following actions

Scan the QR code to install the App and get 2 free unlocks

Unlock quizzes for free by uploading documents