Let  be the cumulative distribution function for the number of credits taken by students at a community college. Some values of
  are shown in the following table. What was the median number of credit hours taken by the students?
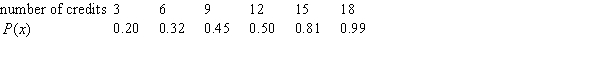
Correct Answer:
Verified
Q31: The following figure shows a density function
Q32: The probability of waiting no more than
Q33: Which of the following could possibly be
Q34: Let p(t) be a probability density
Q35: The heights, in inches, of flowers in
Q37: Which of the following cumulative distribution graphs
Q38: The cumulative distribution function for the time
Q39: The heights, in inches, of flowers in
Q40: The life expectancy of a bug can
Q41: The density function for lunch time taken
Unlock this Answer For Free Now!
View this answer and more for free by performing one of the following actions

Scan the QR code to install the App and get 2 free unlocks

Unlock quizzes for free by uploading documents