The following figure gives the density function for the velocities of cars passing a checkpoint on a freeway. What percent of the cars drove less than 60 mph? 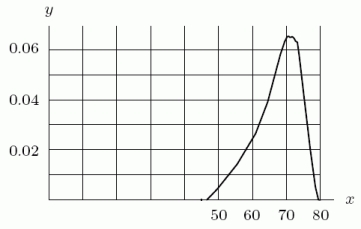
A) 5%
B) 15%
C) 25%
D) 35%
Correct Answer:
Verified
Q1: The density function f(x) shown below describes
Q2: A density function for the age of
Q3: The distribution of heights, x, in meters,
Q5: Which of the following could possibly be
Q6: The following figure gives the density function
Q7: Suppose that the distribution of people's ages
Q8: An aptitude test is given to a
Q9: A professor far away from here gives
Q10: The following figure gives the density function
Q11: Suppose ![]()
Unlock this Answer For Free Now!
View this answer and more for free by performing one of the following actions

Scan the QR code to install the App and get 2 free unlocks

Unlock quizzes for free by uploading documents