Multiple Choice
A density function for the lifetime of a certain type of frog is shown in the following figure. Which is the frog's lifetime more likely to be between? 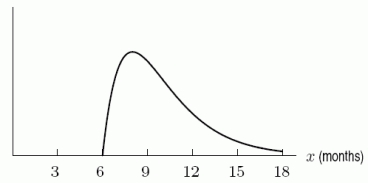
A) 7 and 8 months
B) 10 and 11 months
C) 13 and 14 months
Correct Answer:
Verified
Related Questions
Q9: A professor far away from here gives
Q10: The following figure gives the density function
Q11: Suppose Q12: The density function f(x) shown below describes Q13: A density function for the daily calorie Q15: The cumulative distribution function in the second Q16: A professor far away from here gives![]()
Unlock this Answer For Free Now!
View this answer and more for free by performing one of the following actions

Scan the QR code to install the App and get 2 free unlocks

Unlock quizzes for free by uploading documents