Essay
Below is a contour diagram depicting D, the average fox population density as a function of  , kilometers east of the western end of England, and
  , kilometers north of the same point.
 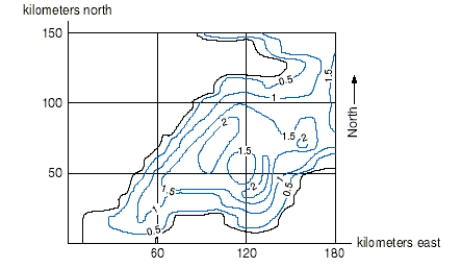 Is D increasing or decreasing at the point (120, 25) in the northern direction?
Correct Answer:
Verified
The function is increasing in ...
View Answer
Unlock this answer now
Get Access to more Verified Answers free of charge
Related Questions


