The following table gives the number f(x, y) of grape vines, in thousands, of age x in year y. 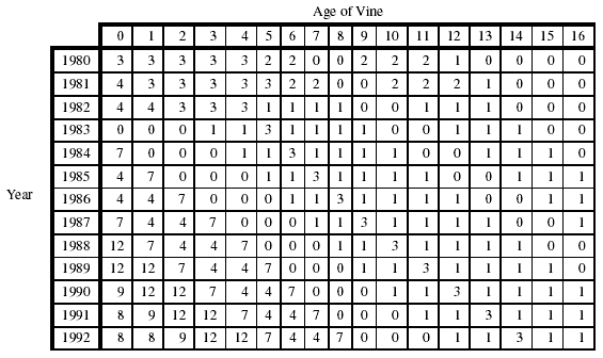 In one year a fungal disease killed most of the older grapevines, and in the following year a long freeze killed most of the young vines. Which are these years?
Correct Answer:
Verified
Q1: The following table shows the revenue R,
Q3: A company sells two products. The fixed
Q4: The following table shows the revenue R,
Q5: A company sells two products. The fixed
Q6: The following figure shows contours for the
Q7: The profit, P, from producing a product
Q8: The following table shows the revenue R,
Q9: The following table shows the revenue R,
Q10: You are in a nicely heated cabin
Q11: The cost, C, of renting a car
Unlock this Answer For Free Now!
View this answer and more for free by performing one of the following actions

Scan the QR code to install the App and get 2 free unlocks

Unlock quizzes for free by uploading documents