Which of the following graphs illustrates the growth curve of a small population of rodents that has grown to reach a static carrying capacity?
A) 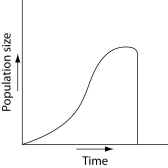
B) 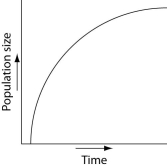
C) 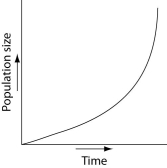
D) 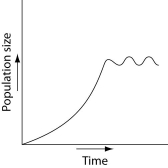
E) 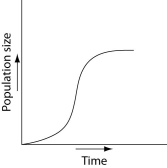
Correct Answer:
Verified
Q38: Logistic growth of a population is represented
Q39: Which of the following statements about the
Q40: Often the growth cycle of one population
Q41: Use the survivorship curves in Figure 53.1
Q42: Which statement best explains survivorship curve B?
A)
Q44: Which of the following graphs illustrates the
Q45: Why do populations grow more slowly as
Q46: Please read the paragraph below and review
Q47: A population of white-footed mice becomes severely
Q48: Why is territoriality an adaptive behavior for
Unlock this Answer For Free Now!
View this answer and more for free by performing one of the following actions

Scan the QR code to install the App and get 2 free unlocks

Unlock quizzes for free by uploading documents