Which graph below best represents the way that density changes over time in a physoclistus fish and in a physostomus fish, respectively?
A. 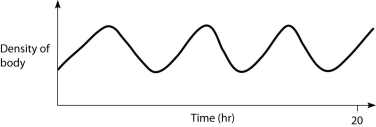
B. 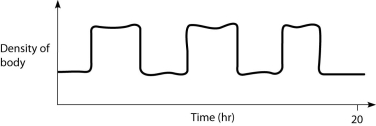
C. 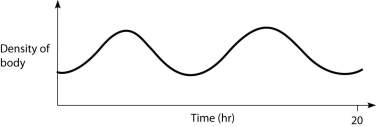
D. 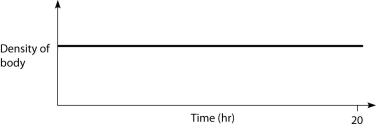
A) A and B
B) B and A
C) B and C
D) C and B
E) D and B
Correct Answer:
Verified
Q73: The following questions refer to the phylogenetic
Q74: The following questions refer to the phylogenetic
Q75: If a ray-finned fish is to both
Q76: Which graph properly depicts the relationship between
Q77: The following questions refer to the phylogenetic
Q79: At 5, 10, and 15 hours in
Q80: The following questions refer to the description
Q81: The one-way flow of air along parabronchi
Q82: In the United States and Canada, bats
Q83: The following questions refer to the description
Unlock this Answer For Free Now!
View this answer and more for free by performing one of the following actions

Scan the QR code to install the App and get 2 free unlocks

Unlock quizzes for free by uploading documents