The figure shows planned aggregate expenditure and output for an economy. 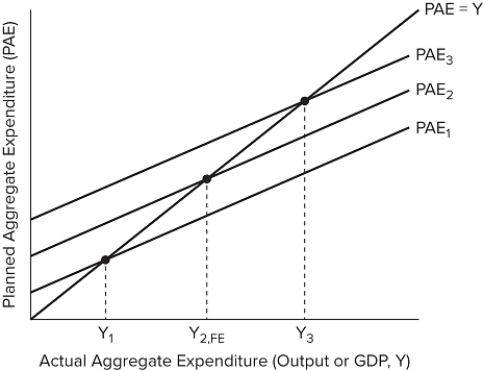 The distance between what 2 lines illustrate a recessionary output gap?
A) PAE 2 to PAE 3
B) PAE 1 to PAE 2
C) Y 1 to Y 2
D) Y 2 to Y 3
Correct Answer:
Verified
Q114: The figure shows planned aggregate expenditure and
Q115: The figure shows planned aggregate expenditure and
Q116: If the MPC is 0.5, what must
Q117: If the MPC is 0.75, what must
Q118: The multiplier effect suggests that:
A) spending $1
Q120: What is the calculation for the simplified
Q121: If the government wishes to increase GDP
Q122: If the MPC is 0.6, and the
Q123: If the government wishes to increase GDP
Q124: If spending decreases by $400, and GDP
Unlock this Answer For Free Now!
View this answer and more for free by performing one of the following actions

Scan the QR code to install the App and get 2 free unlocks

Unlock quizzes for free by uploading documents