The figure shows planned aggregate expenditure and output for an economy. 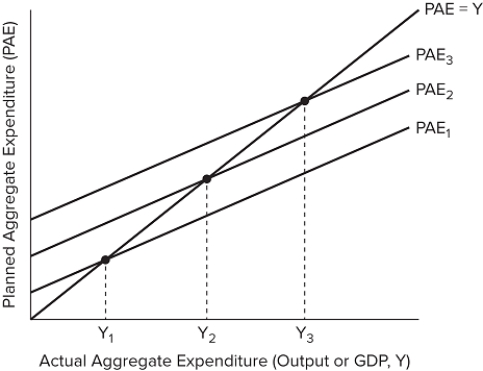 Suppose that the economy starts at PAE2. Which change would shift the PAE curve upward?
A) An increase in wealth.
B) An increase in interest rates.
C) And increase in taxes.
D) An increase in imports.
Correct Answer:
Verified
Q94: The figure shows planned aggregate expenditure and
Q95: When PAE increases, we expect that the
Q96: The figure shows planned aggregate expenditure and
Q97: The figure shows planned aggregate expenditure and
Q98: The figure shows planned aggregate expenditure and
Q100: Economic environments that have higher levels of
Q101: The figure shows planned aggregate expenditure and
Q102: If the MPC is 0.8, what must
Q103: The spending multiplier grows _ as the
Q104: The spending multiplier tells us the amount
Unlock this Answer For Free Now!
View this answer and more for free by performing one of the following actions

Scan the QR code to install the App and get 2 free unlocks

Unlock quizzes for free by uploading documents