The graph below shows how the amount of fuel in the tank of a car decreases as the car is driven. Find the slope of the line between the two points shown on the graph, namely (50, 15) and (150, 9) . Write a sentence that states the meaning of the slope. 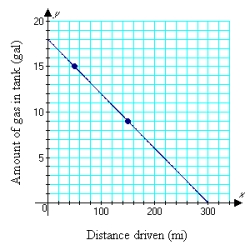
A) m = -0.06; For each 100 miles the car is driven, approximately 0.06 gal of fuel is used.
B) m = -0.06; For each mile the car is driven, approximately 0.06 gal of fuel is used.
C) m = -0.06; The car averages approximately 60 miles per gallon.
D) m = 0.06; For each mile the car is driven, approximately 0.06 gal of fuel is used.
E) m = -0.6; For each mile the car is driven, approximately 0.6 gal of fuel is used.
Correct Answer:
Verified
Q36: Given the function Q37: Find the range of the function defined Q38: Graph: Q39: What values are excluded from the domain Q40: Does the diagram below represent a function? Q42: Graph by using the slope and y-intercept: Q43: Find the slope of the line containing Q44: Graph by using the slope and y-intercept: Q45: The graph below shows the relationship between Q46: The graph below shows the relationship between![]()
![]()
Unlock this Answer For Free Now!
View this answer and more for free by performing one of the following actions

Scan the QR code to install the App and get 2 free unlocks

Unlock quizzes for free by uploading documents