The graph below shows the number of gallons of water remaining in a pool x minutes after a pump is turned on to drain the pool. Find the slope of the line between the two points shown on the graph, namely (0, 32) and (25, 5) . Write a sentence that states the meaning of the slope. 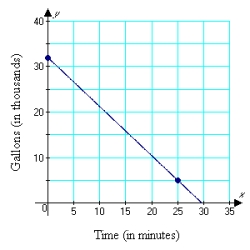
A) m = -1.08; Each minute, 1080 gallons are being drained from the pool.
B) m = -1.08; Each minute, 1.08 gallons are being drained from the pool.
C) m = -0.93; Every 25 minutes, 930 gallons are being drained from the pool.
D) m = -1.08; Every 25 minutes, 1080 gallons are being drained from the pool.
E) m = -0.93; Each minute, 930 gallons are being drained from the pool.
Correct Answer:
Verified
Q46: The graph below shows the relationship between
Q47: Find the slope of the line containing
Q48: Find the equation of the line that
Q49: Find the equation of the line that
Q50: Graph by using the slope and y-intercept:
Q52: Graph: Q53: Graph: Q54: A custom-illustrated sign or banner can be Q55: Find the x- and y-intercepts of the Q56: Graph: Unlock this Answer For Free Now! View this answer and more for free by performing one of the following actions Scan the QR code to install the App and get 2 free unlocks Unlock quizzes for free by uploading documents![]()
![]()
![]()

