The scatter diagram below shows the record times for races of different lengths at a junior high school track meet, where x is the length of the race in meters and y is the time of race in seconds. Suppose the school adds a 500-meter race. How will that change the scatter plot? Will the graph have the same number of points or an additional point? 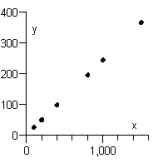
A) The point will be graphed with an x-coordinate of 500 and a y-coordinate equal to the record time for the 500-meter race. The graph will not have an additional point.
B) The point will be graphed with an x-coordinate of 500 and a y-coordinate equal to the record time for the 500-meter race. The graph will have an additional point.
C) The point will be graphed with an x-coordinate equal to the record time for the 500-meter race and a y-coordinate of 500. The graph will have an additional point.
D) The point will be graphed with an x-coordinate equal to the record time for the 500-meter race and a y-coordinate of 500. The graph will not have an additional point.
E) The point will be graphed with an x-coordinate of 500 and a y-coordinate of 500. The graph will not have an additional point.
Correct Answer:
Verified
Q12: Name the abscissa of the point below.
Q13: Name the ordinate of the point below.
Q14: Is (-2, -10) a solution of
Q15: In which quadrant does the given point
Q16: Find the coordinates of the point below.
Q18: Find the coordinates of the point below.
Q19: In which quadrant does the given point
Q20: The scatter diagram below pairs numbers of
Q21: A real estate appraiser charges a fee
Q22: What values are excluded from the domain
Unlock this Answer For Free Now!
View this answer and more for free by performing one of the following actions

Scan the QR code to install the App and get 2 free unlocks

Unlock quizzes for free by uploading documents