(Table) If the numbers in the table were placed on a graph, with hot chocolate sales on the vertical axis and temperature on the horizontal axis, the slope would be 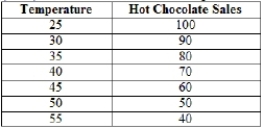
A) -10.
B) -2.
C) -1/2.
D) 2.
Correct Answer:
Verified
Q256: (Figure: Graph Interpretation) In the graph, the
Q257: (Figure: Interpreting Equations on a Graph) In
Q258: Scarcity is BEST defined as when
A) the
Q259: Thinking at the margin involves
A) influencing how
Q260: In the equation S = 130 -
Q262: The economics of uranium mining would be
Q263: Sujata has a stopover in Iceland and
Q264: The opportunity cost of one good is
Q265: Microeconomics looks at particular markets within an
Q266: Time series graphs include the value of
Unlock this Answer For Free Now!
View this answer and more for free by performing one of the following actions

Scan the QR code to install the App and get 2 free unlocks

Unlock quizzes for free by uploading documents