(Table) If the numbers in the table were placed on a graph, with hot chocolate sales on the vertical axis and temperature on the horizontal axis, a 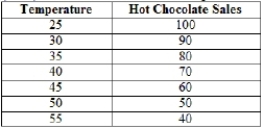
A) positive, nonlinear curve would result.
B) negative, linear relationship between temperature and hot chocolate sales would be shown.
C) positive, linear relationship between temperature and hot chocolate sales would be shown.
D) negative, nonlinear curve would result.
Correct Answer:
Verified
Q157: Which statement is TRUE about specialization and
Q158: The concept of scarcity
A) exists in all
Q159: (Figure: Mileage and Speed by Car Weight)
Q160: A strong monetary system is an example
Q161: _ costs include the time and money
Q163: Opportunity costs exist because
A) using resources for
Q164: Which statement does NOT describe model building
Q165: If the price of carrots drops, ceteris
Q166: Scatter plots use time and one other
Q167: Government intervention in the market is helpful
Unlock this Answer For Free Now!
View this answer and more for free by performing one of the following actions

Scan the QR code to install the App and get 2 free unlocks

Unlock quizzes for free by uploading documents