(Figure: Understanding SRAS and LRAS Shifts) This graph shows _____ policies. 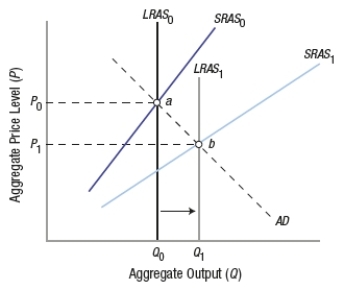
A) demand-side fiscal
B) supply-side fiscal
C) a combination of supply-side and demand-side fiscal
D) demand-side monetary
Correct Answer:
Verified
Q58: Reducing tax rates can _ aggregate demand
Q59: Which graph BEST depicts the impact of
Q60: Expansionary fiscal policy is typically used to
Q61: Politicians eagerly use contractionary policies that control
Q62: The _ lag is the time required
Q64: An intergenerational tax burden means that future
Q65: Which of these is NOT an element
Q66: An automatic stabilizer
A) injects money into the
Q67: Functional finance emphasizes economic growth and price
Q68: As GDP increases, tax revenues _, which
Unlock this Answer For Free Now!
View this answer and more for free by performing one of the following actions

Scan the QR code to install the App and get 2 free unlocks

Unlock quizzes for free by uploading documents