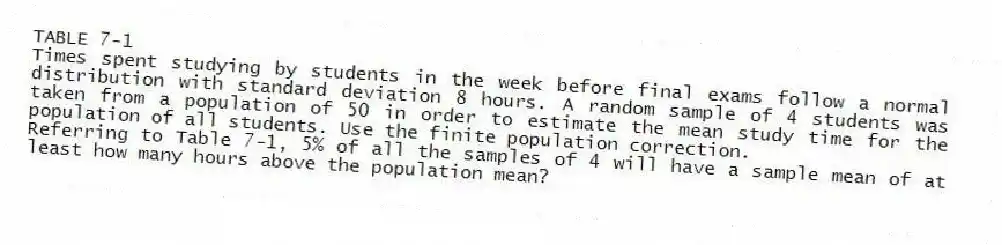
TABLE 7-1
Times spent studying by students in the week before final exams follow a normal distribution with standard deviation 8 hours. A random sample of 4 students was taken from a population of 50 in order to estimate the mean study time for the population of all students. Use the finite population correction.
-Referring to Table 7-1, 5% of all the samples of 4 will have a sample mean of at least how many hours above the population mean?
Correct Answer:
Verified
Q53: TABLE 7-1
Times spent studying by students in
Q54: TABLE 7-2
According to a survey, only 15%
Q55: TABLE 7-1
Times spent studying by students in
Q56: The finite population correction factor is
A)
Q57: TABLE 7-2
According to a survey, only 15%
Q59: TABLE 7-1
Times spent studying by students in
Q60: TABLE 7-1
Times spent studying by students in
Q61: TABLE 8-1
A random sample of 100 stores
Q62: TABLE 7-2
According to a survey, only 15%
Q63: TABLE 8-1
A random sample of 100 stores
Unlock this Answer For Free Now!
View this answer and more for free by performing one of the following actions

Scan the QR code to install the App and get 2 free unlocks

Unlock quizzes for free by uploading documents