(Figure: Understanding Aggregate Graphs 2) 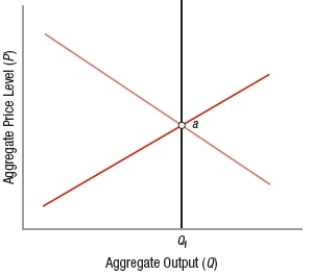 If an economy is at point a, this figure depicts the economy in
A) long-run equilibrium only.
B) short-run equilibrium only.
C) both short-run and long-run equilibrium.
D) neither short-run nor long-run equilibrium.
Correct Answer:
Verified
Q244: The concept of the vertical long-run aggregate
Q245: The 1973 oil shocks created
A) demand-pull inflation.
B)
Q246: _ taxes and _ interest rates in
Q247: The difference between the Keynesian model and
Q248: An increase in interest rates will cause
Q250: The aggregate supply curve in the long
Q251: A(n) _ in productivity and a(n) _
Q252: A(n) _ in oil prices and a(n)
Q253: Who recognized the need to develop tools
Q254: (Figure: Predicting Aggregate Demand Shifts) Which of
Unlock this Answer For Free Now!
View this answer and more for free by performing one of the following actions

Scan the QR code to install the App and get 2 free unlocks

Unlock quizzes for free by uploading documents