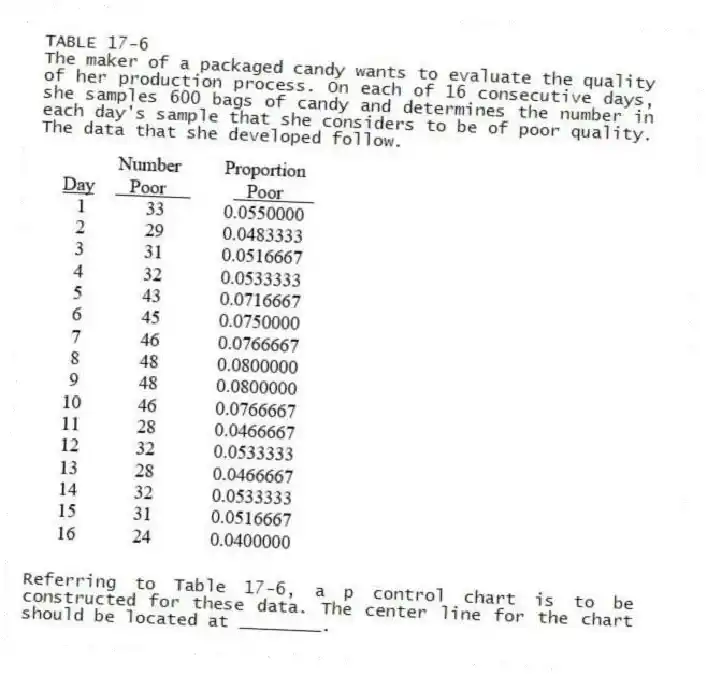
TABLE 17-6
The maker of a packaged candy wants to evaluate the quality of her production process. On each of 16 consecutive days, she samples 600 bags of candy and determines the number in each day's sample that she considers to be of poor quality. The data that she developed follow. 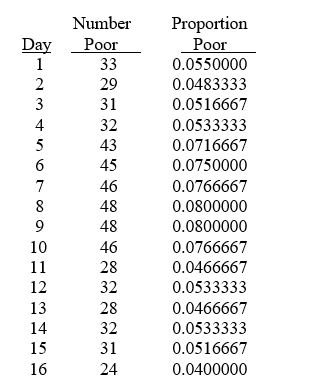
-Referring to Table 17-6, a p control chart is to be constructed for these data. The center line for the chart should be located at ________.
Correct Answer:
Verified
Q42: In the United States,the control limits on
Q43: The cause of variation that can be
Q45: TABLE 17-5
A manufacturer of computer disks took
Q46: TABLE 17-5
A manufacturer of computer disks took
Q46: The p chart is a control chart
Q49: TABLE 17-5
A manufacturer of computer disks took
Q51: TABLE 17-5
A manufacturer of computer disks took
Q52: TABLE 17-6
The maker of a packaged candy
Q55: TABLE 17-5
A manufacturer of computer disks took
Q58: _ causes of variation are correctable without
Unlock this Answer For Free Now!
View this answer and more for free by performing one of the following actions

Scan the QR code to install the App and get 2 free unlocks

Unlock quizzes for free by uploading documents