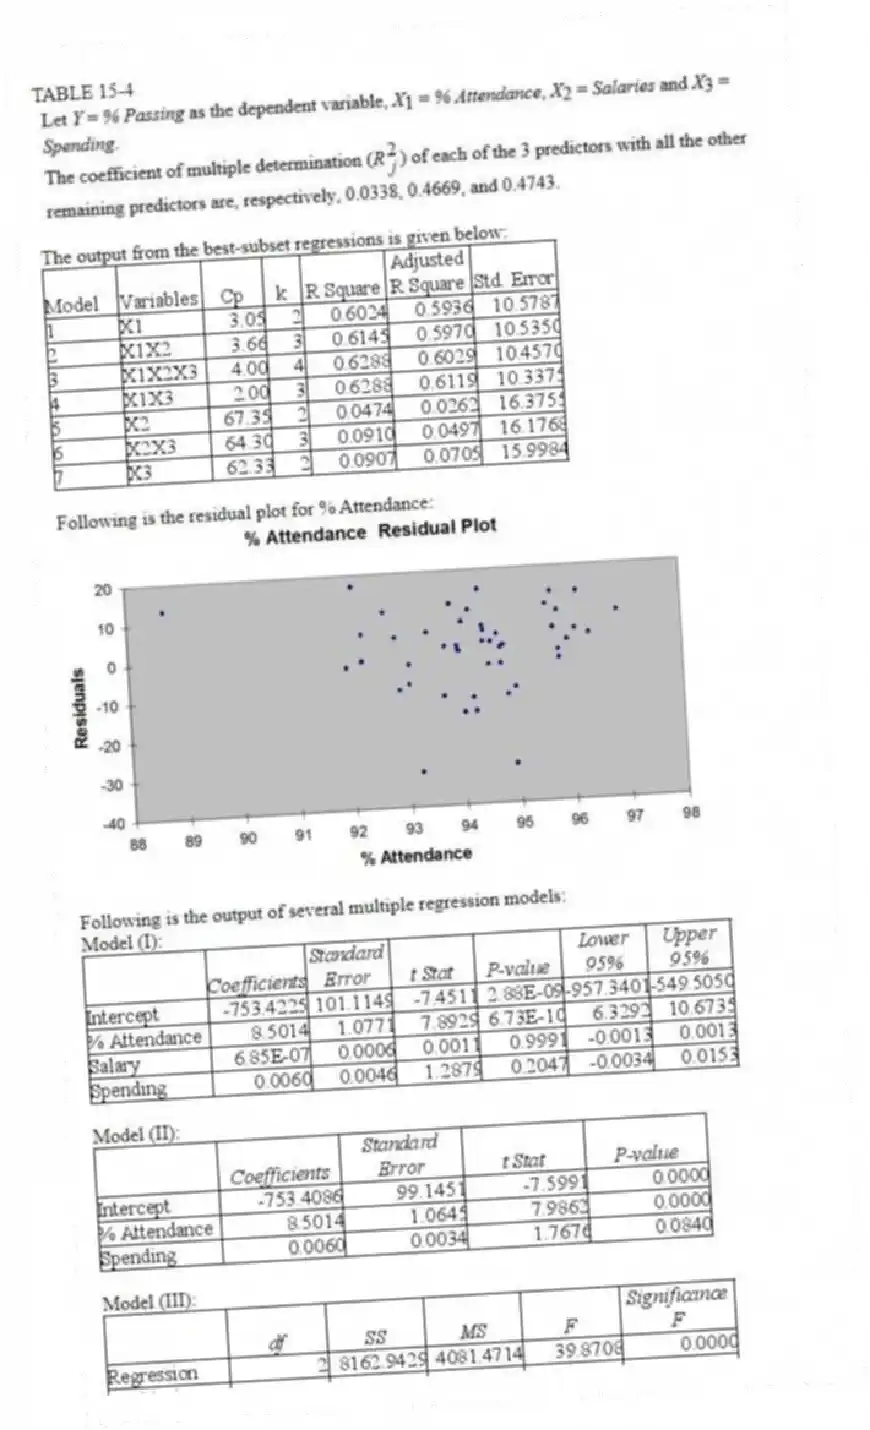
TABLE 15-4

The output from the best-subset regressions is given below:

Following is the residual plot for % Attendance:

Following is the output of several multiple regression models:
Model (I):

Model (II):

Model (III):

-Referring to Table 15-4, what is the p-value of the test statistic to determine whether the quadratic effect of daily average of the percentage of students attending class on percentage of students passing the proficiency test is significant at a 5% level of significance?
Correct Answer:
Verified
Q70: TABLE 15-6
Given below are results from the
Q71: TABLE 15-5
What are the factors that determine
Q72: TABLE 15-5
What are the factors that determine
Q73: TABLE 15-5
What are the factors that determine
Q74: TABLE 15-6
Given below are results from the
Q76: TABLE 15-5
What are the factors that determine
Unlock this Answer For Free Now!
View this answer and more for free by performing one of the following actions

Scan the QR code to install the App and get 2 free unlocks

Unlock quizzes for free by uploading documents