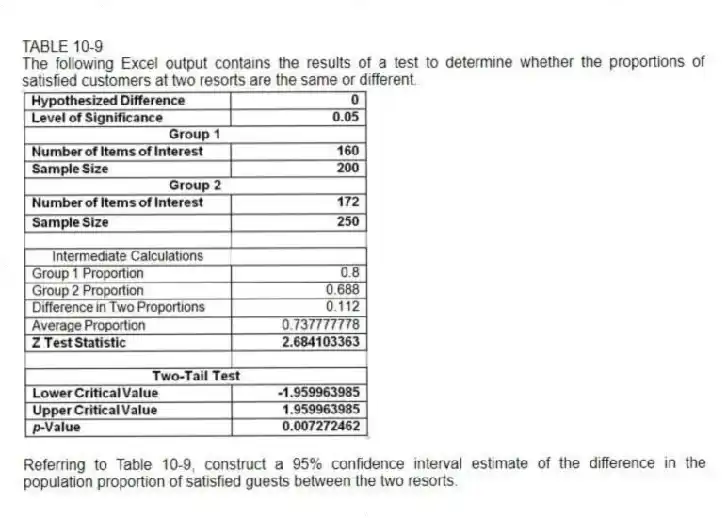
TABLE 10-9
The following Excel output contains the results of a test to determine whether the proportions of satisfied customers at two resorts are the same or different.
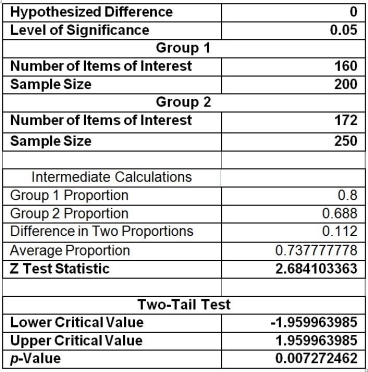
-Referring to Table 10-9, construct a 95% confidence interval estimate of the difference in the population proportion of satisfied guests between the two resorts.
Correct Answer:
Verified
Q135: TABLE 10-10
A corporation randomly selects 150 salespeople
Q136: TABLE 10-9
The following Excel output contains the
Q137: TABLE 10-8
A few years ago, Pepsi invited
Q138: TABLE 10-10
A corporation randomly selects 150 salespeople
Q139: TABLE 10-10
A corporation randomly selects 150 salespeople
Q141: TABLE 10-11
The dean of a college is
Q142: TABLE 10-12
A quality control engineer is in
Q143: When testing for the difference between 2
Q144: TABLE 10-11
The dean of a college is
Q145: TABLE 10-11
The dean of a college is
Unlock this Answer For Free Now!
View this answer and more for free by performing one of the following actions

Scan the QR code to install the App and get 2 free unlocks

Unlock quizzes for free by uploading documents