What is the line in this graph called? 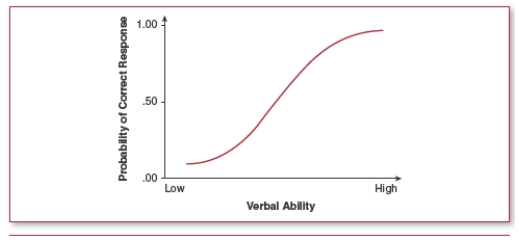
A) normal curve
B) regression line
C) item characteristic curve
D) probability curve
Correct Answer:
Verified
Q52: Describe how we collect, analyze, and interpret
Q53: What is the purpose of an item
Q54: While test validity is a statistical concept,
Q55: Which one of the following explanations was
Q56: What is the importance of item difficulty
Q58: What are interitem correlations? What is their
Q59: When the regression lines that predict performance
Q60: When a common regression line for two
Q61: What is item bias? How do test
Q62: Define and describe types of bias in
Unlock this Answer For Free Now!
View this answer and more for free by performing one of the following actions

Scan the QR code to install the App and get 2 free unlocks

Unlock quizzes for free by uploading documents