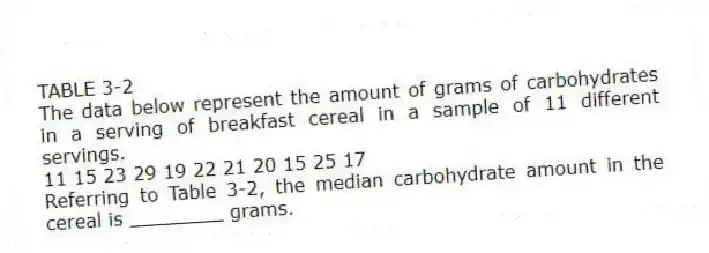
TABLE 3-2
The data below represent the amount of grams of carbohydrates in a serving of breakfast cereal in a sample of 11 different servings.
11 15 23 29 19 22 21 20 15 25 17
-Referring to Table 3-2, the median carbohydrate amount in the cereal is ________ grams.
Correct Answer:
Verified
Q62: TABLE 3-3
The ordered array below represents the
Q63: TABLE 3-2
The data below represent the amount
Q64: If the data set is approximately bell-shaped,the
Q64: TABLE 3-3
The ordered array below represents the
Q65: TABLE 3-3
The ordered array below represents the
Q68: TABLE 3-2
The data below represent the amount
Q72: If a set of data is perfectly
Q72: TABLE 3-2
The data below represent the amount
Q73: The coefficient of variation is a measure
Q74: The geometric mean is useful in measuring
Unlock this Answer For Free Now!
View this answer and more for free by performing one of the following actions

Scan the QR code to install the App and get 2 free unlocks

Unlock quizzes for free by uploading documents