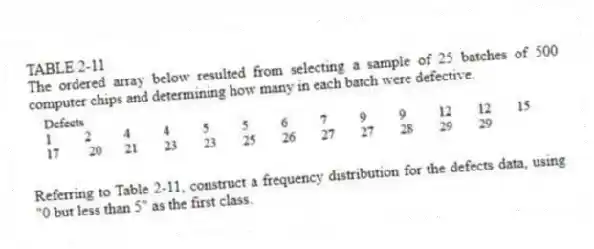
TABLE 2-11
The ordered array below resulted from selecting a sample of 25 batches of 500 computer chips and determining how many in each batch were defective.

-Referring to Table 2-11, construct a frequency distribution for the defects data, using "0 but less than 5" as the first class.
Correct Answer:
Verified
0 but less t...
View Answer
Unlock this answer now
Get Access to more Verified Answers free of charge
Q82: The point halfway between the boundaries of
Q88: TABLE 2-10
The histogram below represents scores achieved
Q89: TABLE 2-10
The histogram below represents scores achieved
Q90: TABLE 2-10
The histogram below represents scores achieved
Q91: TABLE 2-11
The ordered array below resulted from
Q94: TABLE 2-11
The ordered array below resulted from
Q95: TABLE 2-11
The ordered array below resulted from
Q97: TABLE 2-10
The histogram below represents scores achieved
Q98: TABLE 2-10
The histogram below represents scores achieved
Q99: In order to compare one large set
Unlock this Answer For Free Now!
View this answer and more for free by performing one of the following actions

Scan the QR code to install the App and get 2 free unlocks

Unlock quizzes for free by uploading documents