Which of the lines on the figure below is the best representation of the relationship between the volume and the number of moles of a gas, measured at constant temperature and pressure? 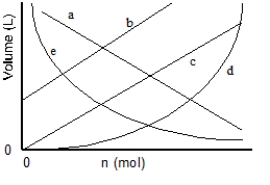
A) a
B) b
C) c
D) d
E) e
Correct Answer:
Verified
Q21: Which of the lines on the figure
Q22: A sample of the inert gas krypton
Q23: "The pressure of an ideal gas is
Q24: A sample of oxygen gas has its
Q25: "The pressure of an ideal gas is
Q27: A sample of carbon dioxide gas at
Q28: The pressure of sulfur dioxide in a
Q29: The pressure of hydrogen sulfide gas in
Q30: Which of the lines on the figure
Q31: Which of the lines on the figure
Unlock this Answer For Free Now!
View this answer and more for free by performing one of the following actions

Scan the QR code to install the App and get 2 free unlocks

Unlock quizzes for free by uploading documents