Multiple Choice
The ratio of working-age population to the elderly in the United States (including projections after 2000) is given by 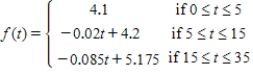
With t = 0 corresponding to the beginning of 1995. What will be the ratio at the beginning of 2005?
A) f(1995) = 35.7
B) f(10) = 4
C) f(10) = -4
D) f(10) = 4.4
E) f(1995) = -35.7
Correct Answer:
Verified
Related Questions
Q142: Economists define the disposable annual income for
Q143: For the demand equation Q144: Experiments conducted by A. J. Clark suggest Q145: The management of Titan Tire Company has![]()
Unlock this Answer For Free Now!
View this answer and more for free by performing one of the following actions

Scan the QR code to install the App and get 2 free unlocks

Unlock quizzes for free by uploading documents