(Figure: Demand Shift) Which of the following could explain the figure? 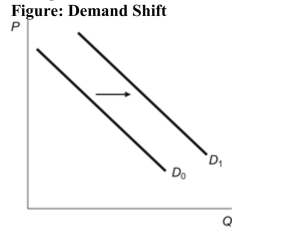
A) Consumer income increases in the market for a normal good.
B) Consumer income falls in the market for a normal good.
C) Consumer income rises in the market for an inferior good.
D) Consumer income falls in the market for a luxury good.
Correct Answer:
Verified
Q23: Coke and Pepsi are substitute soft drinks.
Q25: Which of the following does NOT shift
Q26: (Figure: Demand Shift) Which of the following
Q27: A local university decides to double its
Q30: Mario buys eight units of good X
Q31: (Figure: Earned Consumer Surplus) Refer to the
Q32: Which of the following might happen as
Q33: As the population of elderly in the
Q53: Which one of the following choices would
Q68: A decrease in income causes demand for
Unlock this Answer For Free Now!
View this answer and more for free by performing one of the following actions

Scan the QR code to install the App and get 2 free unlocks

Unlock quizzes for free by uploading documents