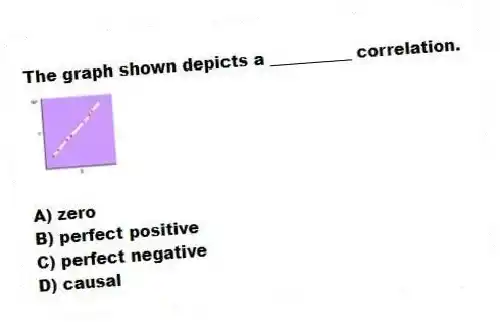
The graph shown depicts a __________ correlation.
A) zero
B) perfect positive
C) perfect negative
D) causal
Correct Answer:
Verified
Q521: A correlation coefficient of -1.09 indicates a(n)
A)strong
Q525: Correlation coefficients can be expressed in numbers
Q526: A correlation coefficient of -.89 indicates a(n)
A)weak
Q527: A correlation coefficient of 0.00 means that
Q531: If a correlational relationship is perfect ,
Q532: A correlation coefficient of 1.36 would be
A)impossible.
B)a
Q533: Which of the following coefficients of correlation
Q536: To estimate the degree of the relationship
Q650: The graph shown depicts a _ correlation.
Q660: Simister and Cooper decided to find out
Unlock this Answer For Free Now!
View this answer and more for free by performing one of the following actions

Scan the QR code to install the App and get 2 free unlocks

Unlock quizzes for free by uploading documents