In the following graph, QS and QD represent the supply and demand curves respectively. Refer to the graph to answer the question. 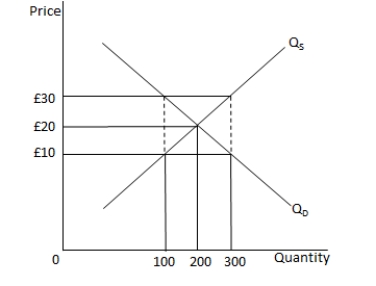
If the market price is £10:
A) the consumers' willingness to pay is lower than the sellers' willingness to supply.
B) there is a shortage in the market.
C) sellers will discount the price until the excess supply is sold.
D) the market is in equilibrium.
Correct Answer:
Verified
Q19: At the equilibrium price, _.
A) buyers have
Q20: If the consumer's income level increases leading
Q21: With demand remaining unchanged, which of the
Q22: The quantity of corn supplied to the
Q23: With a given demand curve, an increase
Q25: If a firm faces a relatively inelastic
Q26: In a free market, a shortage of
Q27: In the following graph, QS1 and QS2
Q28: The supply curve for a good will
Q29: In which of the following cases is
Unlock this Answer For Free Now!
View this answer and more for free by performing one of the following actions

Scan the QR code to install the App and get 2 free unlocks

Unlock quizzes for free by uploading documents