In the following graph, QS and QD represent the supply and the demand curves respectively. Refer to the graph to answer the question. 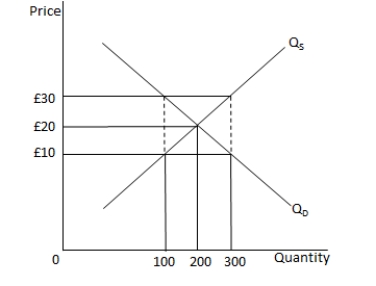 If the market price is £30:
A) the market is in equilibrium.
B) consumers may begin to bid up the price in order to buy more of the product.
C) there is a surplus in the market.
D) no trades will occur in the market.
Correct Answer:
Verified
Q34: Suppose the demand for furniture remains constant.
Q35: In the following graph, QS1 and QS2
Q36: Other things constant, the supply of wheat
Q37: If there is a surplus of a
Q38: The supply curve for a good will
Q40: Assuming that the demand for cars is
Q41: According to Gresham's Law, _.
A) bad products
Q42: If the government sets £1 as the
Q43: Data from the UK Society of Motor
Q44: If the government sets £3 as the
Unlock this Answer For Free Now!
View this answer and more for free by performing one of the following actions

Scan the QR code to install the App and get 2 free unlocks

Unlock quizzes for free by uploading documents