In the following graph, S and D represent the supply and demand curves respectively, in the labour market. Refer to the graph to answer the question. 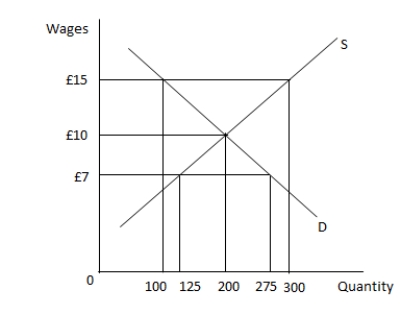 When the wage in the market is set at £15:
A) there is a surplus of 300 workers.
B) there is a shortage of 100 workers.
C) there is a surplus of 200 workers.
D) there is a shortage of 275 workers.
Correct Answer:
Verified
Q38: During periods of rising inflation, there is
Q39: Suppose that the rate of inflation is
Q40: Cost push in?ation can be caused by:
A)
Q41: Which of the following implies that the
Q42: A policy implication of the downward-sloping Phillips
Q44: Unemployment that results when a worker quits
Q45: In the UK, the _ measures the
Q46: In the following graph, S and D
Q47: The balance of payments measures the:
A) difference
Q48: When would inflation targeting using interest rates
Unlock this Answer For Free Now!
View this answer and more for free by performing one of the following actions

Scan the QR code to install the App and get 2 free unlocks

Unlock quizzes for free by uploading documents