A random sample of 30 executives from companies with assets over $1 million was selected and
Asked for their annual income and level of education. The ANOVA comparing the average income
Among three levels of education rejected the null hypothesis. The Mean Square Error (MSE) was
243) 7. The following table summarized the results: 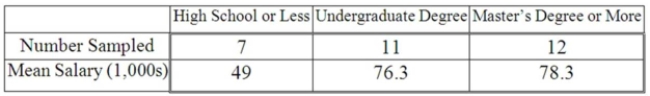
Based on the comparison between the mean annual incomes for executives with Undergraduate
And Master's Degree or more.
A) a confidence interval shows that the mean annual incomes are not significantly different.
B) the ANOVA results show that the mean annual incomes are significantly different.
C) a confidence interval shows that the mean annual incomes are significantly different.
D) the ANOVA results show that the mean annual incomes are not significantly different.
Correct Answer:
Verified
Q82: A manufacturer of automobile transmissions uses three
Q83: A manufacturer of automobile transmissions uses three
Q84: In ANOVA analysis, when the null hypothesis
Q85: A random sample of 30 executives from
Q86: Given the following Analysis of Variance table
Q88: A random sample of 30 executives from
Q89: i. If we want to determine which
Q90: The annual dividend rates for a random
Q91: A random sample of 30 executives from
Q92: If the confidence interval for the difference
Unlock this Answer For Free Now!
View this answer and more for free by performing one of the following actions

Scan the QR code to install the App and get 2 free unlocks

Unlock quizzes for free by uploading documents