A random sample of 25 executives from companies with assets over $1 million was selected and
Asked for their annual income and level of education. The following Excel printout summarized the
Results: 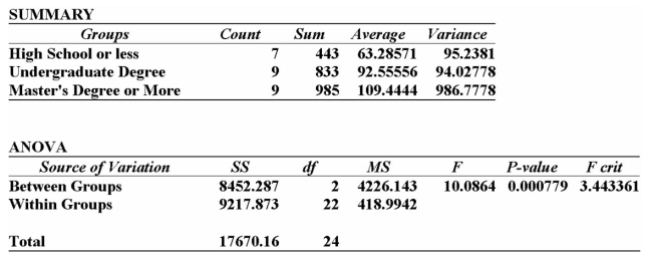
A) Since the calculated F-value is smaller than the F-critical value, there is a significant difference in the incomes of these 3 groups.
B) Since the calculated F-value is smaller than the F-critical value, there is no significant difference in the incomes of these three groups.
C) Since the P-value is 0.001, there is a 10% chance of these results happening when there is no significant difference in the incomes of these three groups.
D) Since the calculated F-value is larger than the F-critical value, and the P-value is so small, there is strong evidence to suggest that all three groups with different levels of education
Have the same incomes.
E) Since the calculated F-value is larger than the F-critical value, and the P-value is so small, there is strong evidence to suggest that the three groups with different levels of education
Correct Answer:
Verified
Q38: Two accounting professors decided to compare the
Q39: i. To employ ANOVA, the populations should
Q40: i. The rejection region for analysis of
Q41: In an effort to determine the most
Q42: Suppose a package delivery company purchased 14
Q44: Three different advertisements were used to sell
Q45: In an effort to determine the most
Q46: An electronics company wants to compare the
Q48: Suppose that an automobile manufacturer designed a
Q49: If an ANOVA test is conducted and
Unlock this Answer For Free Now!
View this answer and more for free by performing one of the following actions

Scan the QR code to install the App and get 2 free unlocks

Unlock quizzes for free by uploading documents