The information below shows the summary statistics of data adapted from Statistics Canada,
Regarding gasoline prices from urban cities across Canada. 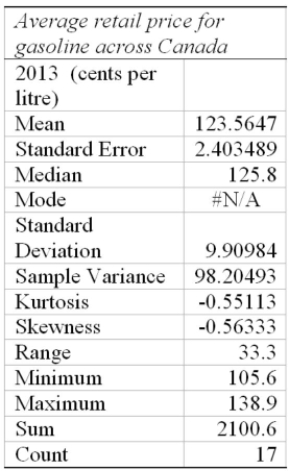
(i. This data is based on values from 17 cities.
(ii. The average gas price in 2013 across the country based on this sample was $1.2356
(iii) 50% of the cities reported average gas prices over $1.23 per litre
A) (i) , (ii) and (iii) are all correct statements
B) (i) and (ii) are correct statements but not (iii) .
C) (i) and (iii) are correct statements but not (ii) .
D) (ii) and (iii) are correct statements, but not (i) .
E) (i) , (ii) and (iii) are all false statements.
Correct Answer:
Verified
Q43: In the calculation of the arithmetic mean
Q203: (i. If two sets of data are
Q204: (i. If two sets of data are
Q205: The following printout is a summary of
Q206: (i. The research director of a large
Q207: i. The sum of the deviations from
Q209: (i. The research director of a large
Q210: (i. Based on the values of the
Q211: (i. If two sets of data are
Q213: The information below shows the summary statistics
Unlock this Answer For Free Now!
View this answer and more for free by performing one of the following actions

Scan the QR code to install the App and get 2 free unlocks

Unlock quizzes for free by uploading documents