Here is a stacked bar chart for data collected about employee blood pressure. 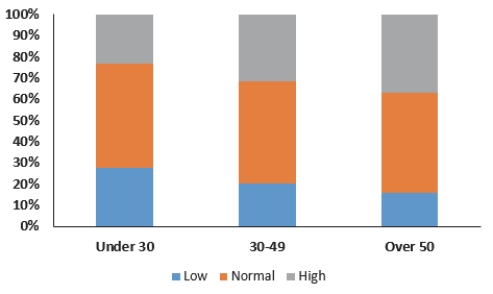 This chart shows
A) the distribution of a quantitative variable.
B) the contingency distribution of blood pressure type.
C) the conditional distribution of blood pressure type.
D) the marginal distribution of blood pressure type.
E) the joint distribution of blood pressure type.
Correct Answer:
Verified
Q35: A restaurant uses comment cards to
Q36: A regional survey was carried out
Q37: A clothing store uses comment cards
Q38: A clothing store uses comment cards
Q39: A company interested in the health
Q41: Accenture, a consulting firm, conducted an
Q42: Accenture, a consulting firm, conducted an
Q43: Accenture, a consulting firm, conducted an
Q44: Accenture, a consulting firm, conducted an online
Q45: Accenture, a consulting firm, conducted an
Unlock this Answer For Free Now!
View this answer and more for free by performing one of the following actions

Scan the QR code to install the App and get 2 free unlocks

Unlock quizzes for free by uploading documents