The scatterplot shows monthly sales figures (in units) and number of months of experience for a sample of salespeople. 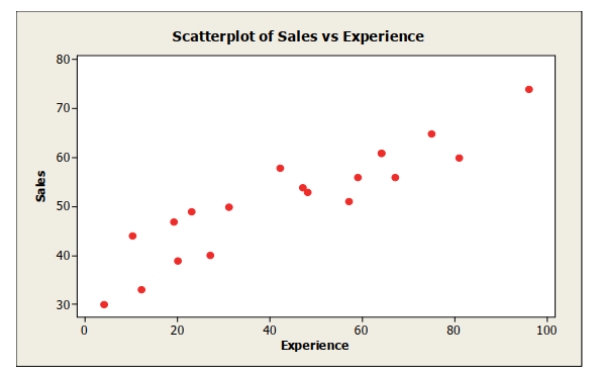 The correlation between monthly sales and level of experience is most likely
A) -.235.
B) 0.
C) .180.
D) -.914.
E) .914.
Correct Answer:
Verified
Q2: Suppose the correlation, r, between two variables
Q12: A study examined consumption levels of oil
Q57: To determine whether the cash bonus
Q58: A business executive taught his managers that
Q59: For each of the following scenarios indicate
Q60: Shown below is a correlation table showing
Q61: Data were collected on monthly sales revenues
Q64: A scatterplot shows a curved relationship between
Q65: A small independent organic food store
Q67: Some people believe that there is a
Unlock this Answer For Free Now!
View this answer and more for free by performing one of the following actions

Scan the QR code to install the App and get 2 free unlocks

Unlock quizzes for free by uploading documents