The following scatterplot shows the percentage of the vote a candidate received in the 2004 senatorial elections according to the voter's income level based on an exit poll of voters conducted by CNN. The income levels 1-8 correspond to the following income classes: 1=Under $15,000; 2=$15-30,000; 3=$30-50,000; 4=$50-75,000; 5=$75-100,000; 6=$100-150,000;
7=$150-200,000; 8=$200,000 or more. 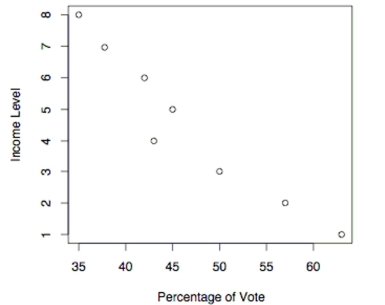
-Use the election scatterplot to the find the value of the rank correlation coefficient
A)
B)
C)
D)
Correct Answer:
Verified
Q23: How does the Wilcoxon rank-sum test compare
Q89: Find the critical value. Assume that
Q90: In using the Kruskal-Wallis test, there
Q91: The following scatterplot shows the percentage
Q92: Find the critical value. Assume that
Q93: The following scatterplot shows the percentage
Q95: Listed below are grade averages for randomly
Q97: A fire-science specialist tests three different
Q98: The table below shows the weights
Q99: Find the critical value. Assume that
Unlock this Answer For Free Now!
View this answer and more for free by performing one of the following actions

Scan the QR code to install the App and get 2 free unlocks

Unlock quizzes for free by uploading documents