Construct an R chart and determine whether the process variation is within statistical control. 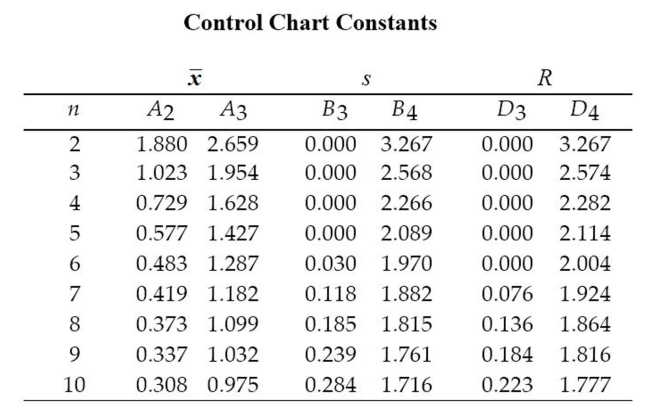 A machine that is supposed to produce ball bearings with a diameter of 7 millimeters yields the following data from a
test of 5 ball bearings every 20 minutes. 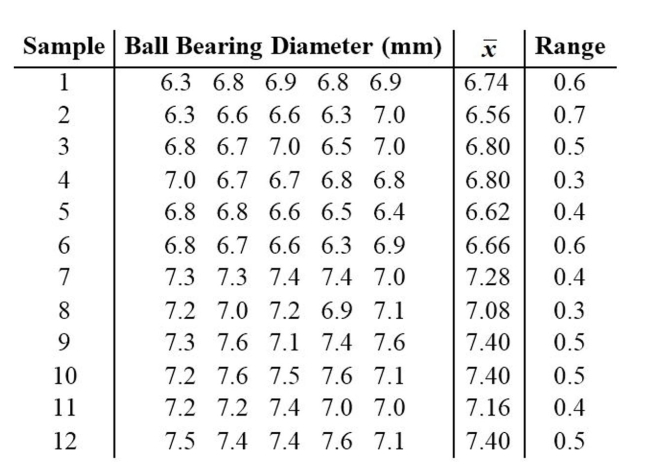
Correct Answer:
Verified
View Answer
Unlock this answer now
Get Access to more Verified Answers free of charge
Q6: Define statistically stable (or "within statistical control").
Q10: Describe the three criteria used to determine
Q22: Provide an appropriate response. A common goal
Q25: Sketch a run chart that that indicates
Q25: A control chart for R is shown
Q26: A control chart for
Q30: Construct a run chart for individual values
Q31: Control charts are used to monitor changing
Q32: Construct an Q33: A run chart for individual values is
Unlock this Answer For Free Now!
View this answer and more for free by performing one of the following actions

Scan the QR code to install the App and get 2 free unlocks

Unlock quizzes for free by uploading documents