Construct a pie chart representing the given data set.
-A television manufacturer sold three times as many televisions in 2005 as it did in 1995. To illustrate this fact,
the manufacturer draws a graph as shown below. The television on the right is three times as tall and three
times as wide as the television on the left. Why is this graph misleading? What visual impression is created by
the graph? 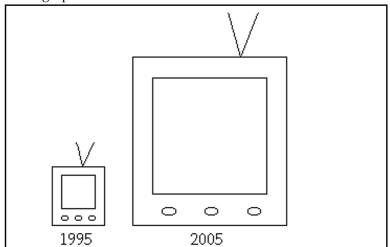
Correct Answer:
Verified
View Answer
Unlock this answer now
Get Access to more Verified Answers free of charge
Q59: Explain in your own words why a
Q117: The following data represent the number of
Q118: Attendance records at a school show
Q119: Solve the problem.
-120 casino patrons, were interviewed
Q120: Use the data to create a
Q123: Construct a pie chart representing the
Q124: Solve the problem.
-A car dealer is
Q125: Construct a pie chart representing the
Q126: Construct a pie chart representing the
Q127: Construct a pie chart representing the given
Unlock this Answer For Free Now!
View this answer and more for free by performing one of the following actions

Scan the QR code to install the App and get 2 free unlocks

Unlock quizzes for free by uploading documents