The following data represent the number of cars passing through a toll booth during a certain time period over a number of days. Which of these choices display the correct dotplot?
A)
Number of Cars Passing Through a Toll Booth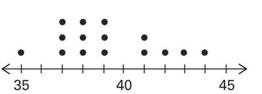
B)
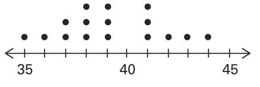
C)
Number of Cars Passing Through a Toll Booth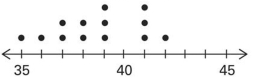
D)
Number of Cars Passing Through a Toll Booth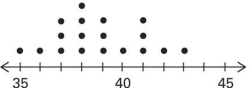
Correct Answer:
Verified
Q17: A nurse measured the blood pressure of
Q18: Q19: Analysis of the data from 25 Q20: The attendance counts for this season's Q21: The Kappa Iota Sigma Fraternity polled its Q23: The following frequency distribution displays the Q24: The frequency distribution below summarizes the Q25: The following data show the number Q26: A nurse measured the blood pressure of Q27: According to USA Today, the largest categories
Unlock this Answer For Free Now!
View this answer and more for free by performing one of the following actions

Scan the QR code to install the App and get 2 free unlocks

Unlock quizzes for free by uploading documents