The histogram below represents the number of television sets per household for a sample of U.S. households. What is the sample size? 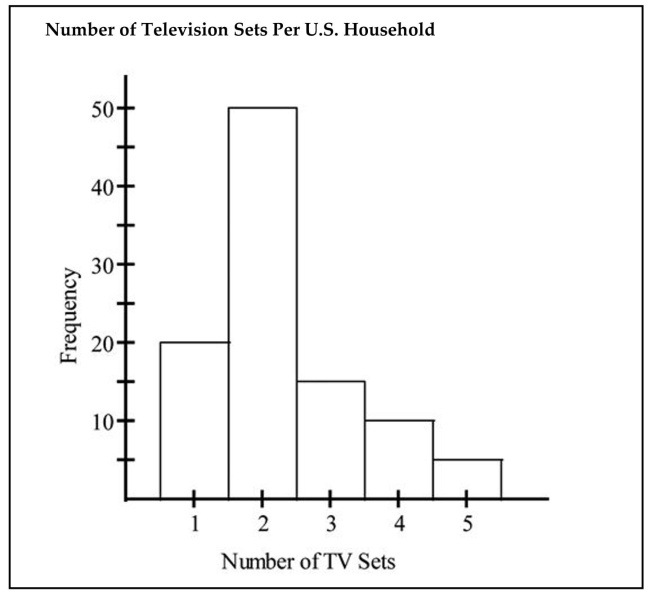
A) 5 households
B) 100 households
C) 50 households
D) 90 households
Correct Answer:
Verified
Q1: The frequency distribution below summarizes employee
Q2: Which of the following cumulative frequency
Q3: The following frequency distribution represents the
Q4: The weights (in pounds) of 22
Q5: The Kappa Iota Sigma Fraternity polled its
Q7: A store manager counts the number
Q8: A nurse measured the blood pressure of
Q9: A nurse measured the blood pressure of
Q10: The scatterplot below displays the amount
Q11: The two key parts of a regression
Unlock this Answer For Free Now!
View this answer and more for free by performing one of the following actions

Scan the QR code to install the App and get 2 free unlocks

Unlock quizzes for free by uploading documents